AGIPD-1M Geometry
The AGIPD-1M detector, which is used at the SPB & MID experiments, consists of 16 modules of 512×128 pixels each. Each module is further divided into 16 ASICs, but these are arranged in pairs, so we treat a module as 8 tiles.
To view or analyse detector data, we need to apply geometry to find the positions of pixels.
[1]:
%matplotlib inline
from extra_geom import AGIPD_1MGeometry
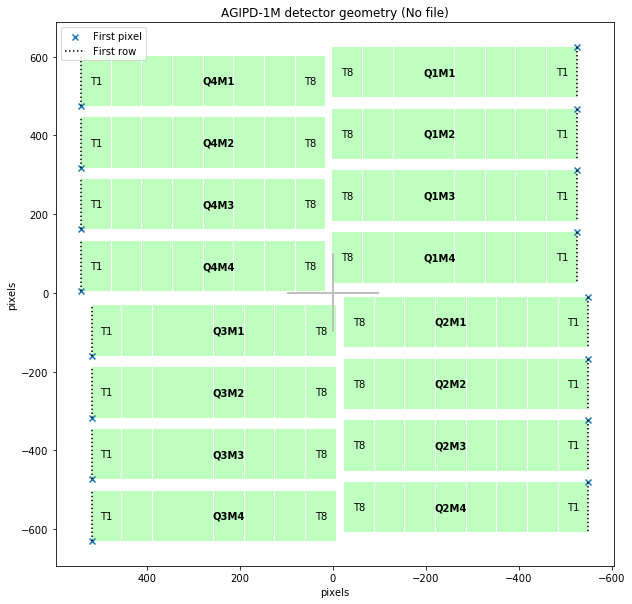
Generate a simple geometry given the (x, y) coordinates of the first pixel in the first module of each quadrant, in pixel units relative to the centre, where the beam passes through the detector.
[2]:
geom = AGIPD_1MGeometry.from_quad_positions(quad_pos=[
    (-525, 625),
    (-550, -10),
    (520, -160),
    (542.5, 475),
])
[3]:
geom.inspect()
[3]:
<matplotlib.axes._subplots.AxesSubplot at 0x2b4e041f9588>
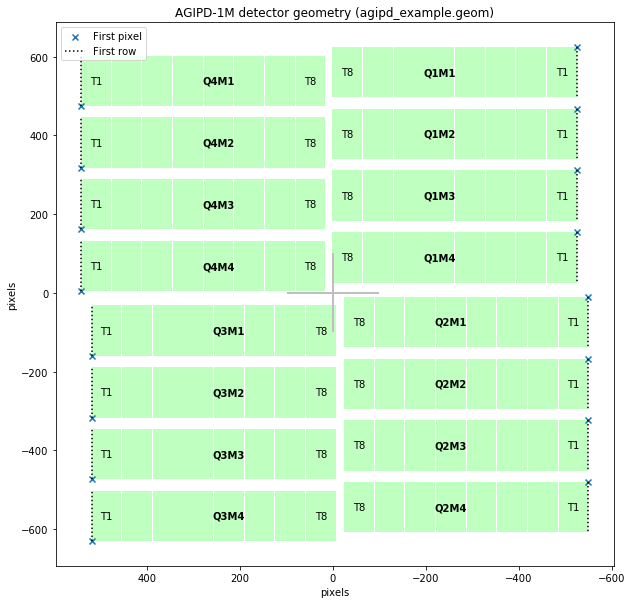
We can also load AGIPD-1M geometry from a CrystFEL format geometry file. These are text based files, often saved with a .geom extension. EXtra-geom expects the tiles in the file to be named p0a0 (panel 0, ASIC 0) up to p15a7.
[15]:
# Create a CrystFEL format geometry file to demonstrate loading it
geom.write_crystfel_geom('agipd_example.geom', clen=0.3, adu_per_ev=1)
[16]:
# Load geometry from CrystFEL format file
geom2 = AGIPD_1MGeometry.from_crystfel_geom('agipd_example.geom')
geom2.inspect()
[16]:
<matplotlib.axes._subplots.AxesSubplot at 0x2b4e0ace8be0>
The code above creates a geometry object for AGIPD-1M. See these examples for how to use a geometry object: